QPI: Query Plan Investigator
If you have spent any real time tuning SQL Server, you know the drill. A query is slow. You capture the execution plan, open it in the built-in viewer, and stare at a wall of operators and arrows. The shapes are all there. What is missing is the answer.
QPI is built to give you the answer.
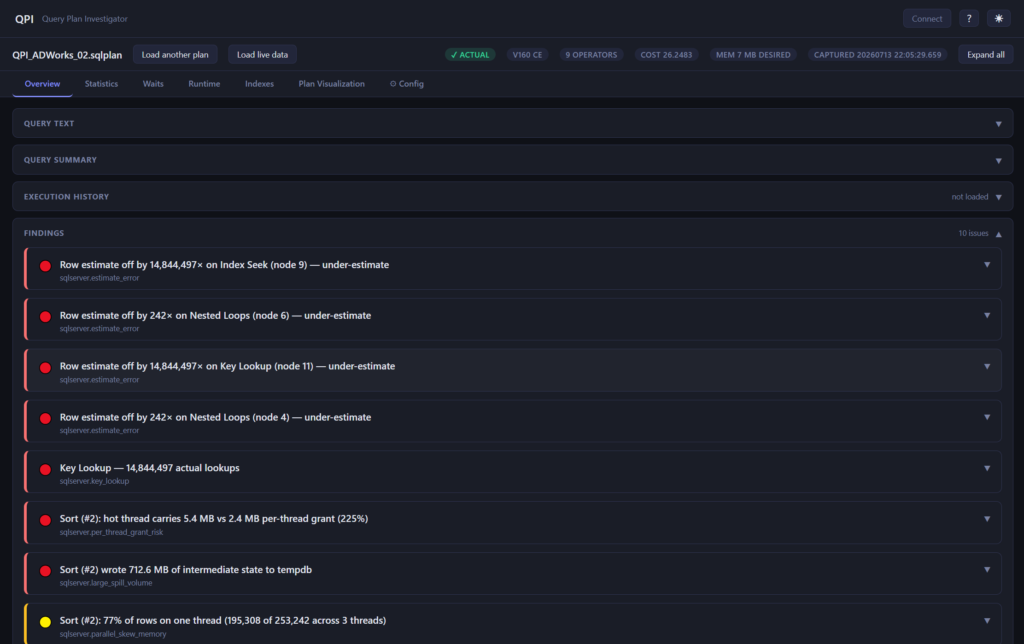
Drop a .sqlplan file into QPI and it reads the plan the way a seasoned DBA reads it: looking for the stale statistics behind a bad estimate, the key lookup that should have been an INCLUDE, the sort that spilled to tempdb because the grant was sized off a guess. Then it writes down what it found, in plain language, with the evidence next to it.
Why not just use the built-in viewer?
The graphical plan in your management tool is a drawing. It shows you the structure of the plan and the relative cost of each operator, and then it stops. Working out why a plan is shaped the way it is, and whether that shape is a problem, is left entirely to you and your experience.
Other dedicated plan viewers on the market render that drawing more cleanly. Nicer layout, better tooltips, more columns. That is genuinely useful, and QPI has a clean visual plan too. But most of them are still describing the plan to you rather than diagnosing it.
QPI is opinionated on purpose. For every issue it finds it gives you three things:
- What it found, as a one-line summary with a severity (red, amber, blue).
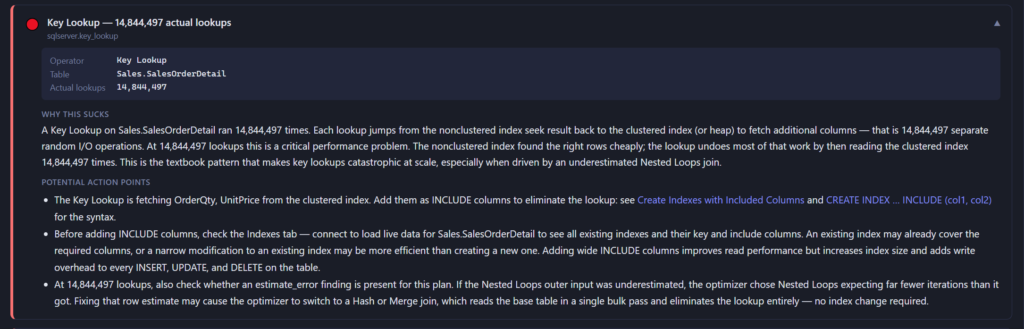
- Why this sucks, a short explanation of the actual mechanism behind the problem.
- Potential action points, concrete next steps, often with the exact T-SQL to run.
That is the difference between a tool that shows you a plan and a tool that helps you fix one.
It gets better when you connect
A plan file is a snapshot. It tells you what the optimizer believed at compile time. It does not tell you whether those beliefs are still true.
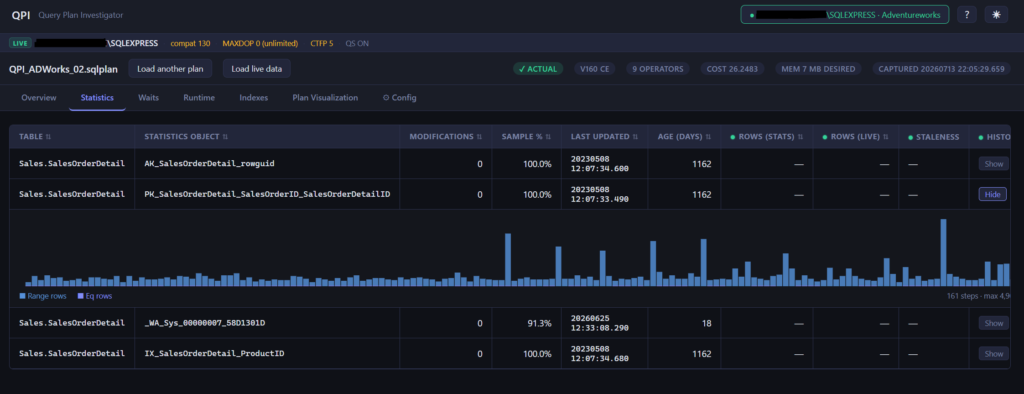
Connect QPI to the server the plan came from and the findings grow real evidence. A stale-statistics finding stops saying “the histogram may be out of date” and starts saying “the table has grown to 4.2 million rows, the stats believe 900 thousand, that is a 367% drift”. A missing-index suggestion can show how many times the server has actually wanted that index since the last restart. You stop guessing and start reading facts.
QPI never writes to your server. It reads from system views and DMVs only, over a connection that lives entirely on your own machine. More on that in Connecting to a live server.
What QPI does today
- Reads actual and estimated execution plans from
.sqlplanand Showplan XML files. - Runs a pack of plan-analysis rules and reports findings with severity, evidence, and action points.
- Draws a clean, readable plan diagram with dockable properties and an operators table.
- Surfaces statistics health, wait breakdowns, runtime metrics, and index usage on their own tabs.
- Scripts missing indexes you can copy straight into a query window.
- Optionally connects to the live server (read only) to enrich findings with current reality.
Where to go next
- Installing QPI: get it running on your machine.
- Your first plan in a minute: the fastest path to a useful answer.
- Reading a plan: a tour of the workspace and the tabs.
- The plan diagram: the visual plan view.
- Connecting to a live server: turn the findings into evidence.
- Understanding findings: what the rules look for, with examples.