Connecting to a live server
A plan file tells you what the optimizer believed when it compiled the query. Connecting QPI to the server the plan came from tells you whether those beliefs are still true. This is where findings stop being informed guesses and start being measured facts.
Connecting is optional. Everything in Your first plan in a minute and most of the findings work on the plan file alone. The live connection adds evidence on top.
What the connection is, and is not
Before anything else, the important part:
- It is read only. QPI reads from system catalog views and dynamic management views (DMVs). It never runs DDL or DML against your server. It cannot change anything.
- It stays on your machine. QPI’s service listens on the loopback address (
127.0.0.1) only. It is not reachable from the network. Your credentials, your plans, and the data QPI reads never leave the box you are sitting at. - You stay in control. You choose when QPI talks to the server. By default it does nothing until you ask.
Connecting
Click Connect in the top-right corner to open the connection panel.
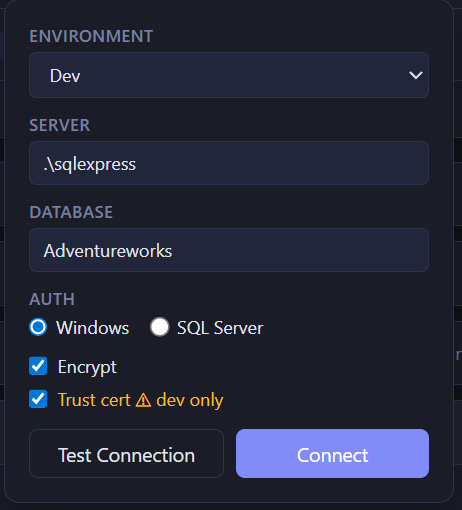
Fill in:
- Environment: tag the connection as Dev, PreProd, or Prod. This is a label to keep you oriented about what you are pointed at.
- Server: the instance, as
SERVER\INSTANCEorHOST,PORT. - Database: the database the plan ran against.
- Auth: Windows authentication, or SQL Server login and password.
- Encrypt:
- Trust cert: only for dev servers with a self-signed certificate. QPI flags this as dev-only on purpose. Leave it off against production.
Use Test Connection to check your details before committing. On success QPI shows you the server name, edition, and compatibility level. Then Connect.
Once connected, the button shows the server and database you are on, and a click reveals server context such as edition, version, MAXDOP, cost threshold for parallelism, and whether Query Store is on.
Loading mode
How and when QPI fetches live data is up to you. Open the Config tab and pick a loading mode.
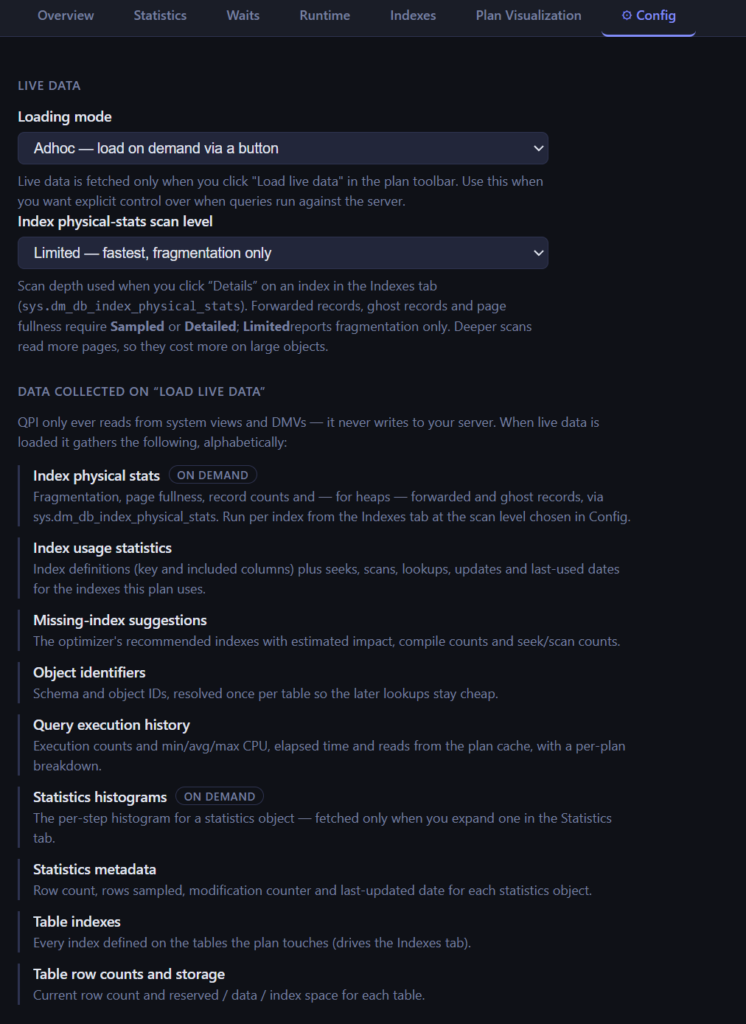
Screenshot: the Config tab showing the “Loading mode” dropdown with the None / Auto / Adhoc options and the explanatory hint text below it.
| Mode | Behaviour |
|---|---|
| None | Live data is never loaded. Analysis uses only the plan file. No queries are sent to the server at all. |
| Auto | Live data loads automatically whenever you open a plan and a connection is active. |
| Adhoc | Live data loads only when you click Load live data in the plan toolbar. Use this when you want explicit control over when queries run. |
If you ever need the comfort of knowing nothing is being sent, None guarantees it.
What QPI reads, and what it gives you back
When live data loads, QPI queries a focused set of read-only sources, scoped to the tables and the query the current plan involves so the footprint stays small:
- Table and partition row counts, to compare against what the statistics believe.
- Statistics metadata and histograms.
- Index definitions and index usage counts (seeks, scans, lookups, updates).
- Execution history for the query, aggregated from the plan cache.
- Missing-index impact from the server’s own missing-index DMVs.
That data flows back into the tabs (the live columns described in Reading a plan) and, more usefully, into the findings themselves as a Live evidence block. A stale-statistics finding gains the real drift between the stats and the table. A key-lookup finding gains the real seek and update counts that tell you whether widening the index is cheap. The execution-history section shows how many times the query has run and how this plan’s CPU, time, and I/O compare to its own history, which is often the clearest tell for parameter sniffing.
Permissions
QPI needs read-only access to system views and DMVs, and nothing more. The account it connects with does not need, and should not have, write access. Here is a least-privilege grant script you can hand to whoever owns the server. Run it as a server administrator.
-- Minimum permissions for a QPI live connection.
-- Run as sysadmin on the target server.

-- Server-scoped DMVs (execution stats, wait stats, plan cache)
GRANT VIEW SERVER STATE TO [qpi_readonly];

-- Database-scoped DMVs (index usage, partition stats, Query Store).
-- Run once per database you want to inspect.
USE [YourDatabase];
GRANT VIEW DATABASE STATE TO [qpi_readonly];

-- The sys catalog views (indexes, columns, statistics) are readable by PUBLIC
-- already, so no extra grant is needed for those.
A couple of notes:
VIEW DATABASE STATEis enough for Query Store reads as well. No extra grant needed.- On SQL Server 2012 and 2014 only, QPI falls back to
DBCC SHOW_STATISTICSfor histograms, which needs SELECT on the object. On those versions add the connecting login todb_datareader:
-- Only needed on SQL Server 2012 / 2014 for the histogram fallback.
ALTER ROLE db_datareader ADD MEMBER [qpi_readonly];
Disconnecting
Open the connection menu and click Disconnect. QPI drops the connection. Switch the loading mode to None if you also want to be certain no further queries run.